If you’ve lived outside of a major city, chances are you know what it’s like to have unpredictable internet. Maybe that means random spikes of >500ms, maybe it means periodic disconnections, or maybe it means your bandwidth is awful. All three were (are) true for me when I lived with my parents, so I searched all around for something that could help me find or prepare for it. I found several utilities that did some of what I wanted, but nothing that did everything–and then they stopped working completely.
Now that I live in a proper city, I’m finding that the need is still there. It’s a little less pressing, sure, but still worth working on. That’s why I fiddled around with JFreeChart and came up with a little tool that did most of what I wanted it to.
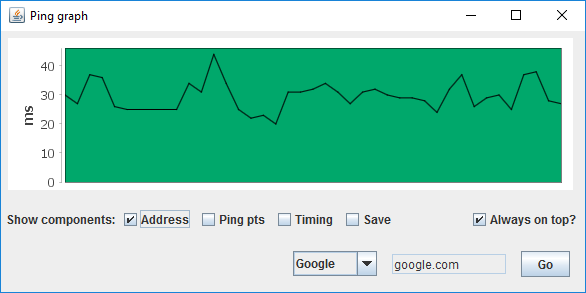
Here’s the utility. You can choose from Google, Bing or Localhost for preset addresses to ping, or enter your own URL. You can change how often it pings and even save a log as a text file. You can change its behavior between always-on-top and not, and it’s resizable.
One other thing: I’ve built in “break points” where the background color will change based on average ping. Fastest is blue, fast is green, slow is yellow, and slowest is orange-red. When no server can be reached, the background turns bright red. You can change these to better suit your average internet ping speed.
I’ll continue to update the application. Feel free to follow along on github, or download a runnable .jar from this link.